Feeds:
Posts
Comments

All data is final as of October 29, 2018.

One of baseball’s most often repeated axioms states that, although home runs work just fine in the regular season, once the calendar turns to October, small ball becomes a more effective method for scoring runs. This mantra is proclaimed with such certainty that all who hear it seem to unquestionably accept its infallibility. However, since the dawn of the wild card era, history has suggested otherwise (though home runs have declined in the post season since 1995, runs scored by other means have dropped more significantly). So, as a service to those home run fanatics who refuse to accept the short comings of the long ball in the post season, the Captain’s Blog Presents the 2018 Long Ball Meter (click on the links for 2016 and 2017), which will not only keep a running breakdown of how runs are scored this postseason, but also present that data in a historical context. In addition, a historical comparison (since 1995) of the share of post season innings by role is also presented.

Current Season Data

Long Ball Meter: Regular Season vs. Postseason, 2018

Note: Long/Small Ball Meter compares the rate of runs scored via the home run to all other means. Regular season data is for playoff teams only.  Averages are per team per game.
Source: Baseball-reference.com

Long Ball vs. Small Ball Tactics: Regular Season vs. Postseason, 2018

Note: Averages are per team per game.
Source: Baseball-reference.com

Continue Reading »

Next season, the Yankees will celebrate the 10th anniversary of their last World Series championship. 2009 was a very memorable season for the Bronx Bombers. The intervening years, well, not so much. Last night’s 4-3 loss to the Red Sox capped off another disappointing end to the Yankees’ season, but, before looking ahead, we need to consider why the Bronx Bombers have become perennial post season also-rans.

One thing is clear. The Yankees did not bow out of the playoffs because they were too reliant upon the home run. During the wild card era, home runs have been a more prevalent means of October scoring in aggregate, and so far, this post season has been no different. Excluding the Yankees, all other October participants have seen the number of runs scored via the homer decline 17%, versus down 27% for all other outcomes. The Bronx Bombers, meanwhile, more closely maintained their level of non-home run scoring, but experienced a much more significant decline in productivity from the long ball. In other words, one reason the Yankees will be watching the ALCS at home is because they didn’t hit enough home runs.

Comparison of Run Production, Regular Season vs. Post Season

Source: Baseball-reference.com

Although the offense certainly deserves part of the blame for the Yankees’ early post season exit, the real culprit was the starting rotation, which had the second worst ERA to date among all playoff teams, ranking ahead of only the Athletics, who used an opener in their lone game. But, even this is too simple of an explanation. In each of the Yankees’ three poor starts, the ineffective pitcher was aided and abetted by his manager.

2018 Post season Starting Rotations (as of 10/10/18)

Source: Baseball-reference.com

In the Wild Card game, a tiring Luis Severino escaped a harrowing fourth inning, and, as he roared off the mound following an inning ending strikeout, it seemed obvious to all, including the pitcher, that his night was over. Aaron Boone, however, had other ideas. Severino started the inning, but promptly gave up two hits. Luckily, Dellin Betances was able to clean up the mess, saving his manager from having to answer for his late hook. Unfortunately for the Yankees, Boone’s reprieve did not result in a lesson learned. In fact, he repeated the same mistake in each of the team’s three losses in the ALDS. Boone’s insistence on trying to squeeze outs from clearly ineffective starters (a tendency he displayed throughout the regular season) not only placed his offense in a hole, but also mitigated against the team’s relative bullpen strength.

So, it’s all Boone’s fault, right? Well, not so fast. Although the deleterious effect he had on the team’s pennant hopes is unquestionable, it’s only fair to point out that his mismanagement was a byproduct of the rotation’s ineffectiveness. And, that is why assigning blame is more nuanced than just pointing a finger at the most glaring failures on the field. After all, if the Yankees had been willing to exceed the luxury tax last season, Justin Verlander would have not only been wearing pinstripes instead of beating the Yankees in 2017, but he would have been the workhorse Boone needed this season. Also, the presence of Verlander might have allowed the Yankees to ease the burden on Severino, who, even without that assist, should have been given some time off during the summer. So, because the Yankees were frugal with Verlander and negligent with Severino, the team entered October with a worn down rotation. Continue Reading »

“Wall Street bankers supposedly back the Yankees; Smith College girls approve of them. God, Brooks Brothers, and United States Steel are believed to be solidly in the Yankees’ corner. The efficiently triumphant Yankee machine is a great institution, but, as they say, who can fall in love with U.S. Steel?” – Gay Talese, There Are Fans – And Yankee Fans (1958)

The Yankees used to be backed by Wall Street bankers. Now, they are run by one. With a self-described “finance geek” at the helm, the Bronx Bombers have a new bottom line. Gone are the days of win at any cost. A successful season is now measured by profit margin, not championships, and to this point, the Yankees are having a banner year.

What about next season? According to recent reports, the best free agents in the game are lining up to wear pinstripes, but the Bronx Bombers may not be interested. Clearly, these are Hal Steinbrenner’s Yankees, not his father’s.

Yankees’ Payroll/Luxury Tax as a Percentage of Team Revenue, 2001 to 2018E

Note: Revenue for each team is net of stadium debt and revenue sharing, and includes non-MLB events at the ballpark. Also excluded was the $18 million payout to each team from the sale of BamTech to Disney as well as profit/loss from RSNs in which teams own equity. Payroll is based on final figures for each year released by MLB, and may not necessarily equal the amount upon which the luxury tax is based.  For 2018E, revenue is Forbes 2017 kept flat, and payroll is set at the luxury tax threshold of $197 million (for a proprietary tracking calculation of the Yankees 2018 payroll, see here).

Source: bizofbaseball.com and MLB releases published by AP (final payroll), MLB releases published by AP (luxury tax) and Forbes (revenue)

As evidenced by the chart above, the Yankees have adopted a new set of financially motivated priorities. With revenue and payroll headed in opposite directions over the past few years, the team now sits near the bottom of the league in terms of revenue spent on players. The numbers don’t lie. And, if you’re not a finance geek, forget about the math. The ring on Justin Verlander’s finger and the pinstripes that aren’t on his back tell the same story.

The Yankees have a lot of money. Sure, the league as a whole is more profitable, and teams from all markets are enjoying heightened income and inflated valuations. And yet, the Yankees still stand well ahead of the pack. According to Forbes, the Bronx Bombers easily led the majors with revenue of $619 million (net of stadium debt and revenue sharing). How accurate is that figure? Well, from verifiable public sources, the Yankees earned over $470 million from ticket sales, suite licenses and local/national TV money alone. That still leaves ownership interests in digital properties (such as the approximately $65 million payment made to all teams following the sale of BamTech), licensing, concessions, sponsorships, postseason ticket/suite revenue and derivative activities such as other businesses and events that benefit from association with the Yankees’ brand (i.e., Legends Hospitality, Pinstripe Bowl, NYFC, etc.).

Forbes estimate may not be exact, but it seems like a pretty good ballpark figure. That’s why, when judged against their means, the team’s recent investment in players has been miserly. There really is no debate in this regard. Uncertain, however, is whether the team’s self-imposed budget is temporary or permanent. Conventional wisdom suggests the Yankees are just waiting to get below the luxury tax so they can open their checkbook once again. However, that optimistic sentiment doesn’t mirror the public comments of Hal Steinbrenner, who has often questioned the need to spend $200 million on frivolous things like champagne, pennants and shiny rings. To a finance geek, intrinsic value only exists to the degree it can be monetized.

Let’s give Hal Steinbrenner the benefit of the doubt and assume he is willing to exceed the luxury tax threshold in 2019. The next question becomes, “by how much”?

Clearly, the Yankees are not returning to the days when they spent nearly 90% of revenue on payroll. And, quite frankly, it would be unreasonable to demand they do so. However, there is a lot of room between that peak and this season’s nearly 30% rate. Is the approximately 45% average for all teams a fair expectation? How about the 56% level recorded by the Bronx Bombers in the five years before the team began its belt tightening in 2013? Both seem like credible figures, so let’s take a look at what level of spending would be commensurate with these rates of investment.

Hypothetical Player Costs versus Estimated Revenue for 2019

Note: figures in $ millions; Revenue range is from 5% below Forbes $619 million 2017 estimate to 10% above. Total Player Costs include Payroll + luxury tax (including surcharges). Blue shaded cells represent rates commensurate with 2017 league average. Green shaded cells represent rates commensurate with Yankees’ average spending level from 2009 to 2013).

Source: Forbes (revenue estimate), MLB CBA, proprietary calculations

Based on a range of revenue assumptions, the Yankees could increase their payroll by about $50-$90 million and still end up spending a league average level of revenue on player costs. And, if the team’s five-year, pre-2014 rate is used as a barometer, the Yankees could increase payroll by a whopping $90-$130 million. Granted, the chart above is not stress tested beyond 2019, at which point the team’s tax penalty will start to rise and cost-controlled players will reach arbitration. However, even if the Yankees boosted 2019 payroll to $270 million, their relative rate of player costs would still be about 56% in 2021 (in line with the pre-2014 five-year average), assuming 5% revenue growth and 7.5% annual payroll increases (team payroll increased 2.5% per year from 2003 to 2013).

Hypothetical Payroll Stress Test, 2019-2021

Note: Revenue is based on 5% increases from Forbes 2017 revenue estimate of $619 million. Payroll is increased by 7.5% each season. Total Payroll Cost includes Payroll plus luxury tax (including surcharges).

Source: Forbes (revenue estimate), MLB CBA, proprietary calculations

The models provided above are by no means exact. They rely on revenue growth assumptions that could prove to be too aggressive, and do not contemplate the terms of the next collective bargaining agreement (the current CBA expires in 2021). And yet, they illustrate the degree to which the Yankees have under-invested in players. So, if there is a debate this off season, it shouldn’t be about signing either Manny Machado or Bryce Harper; the question should center on signing both (or some other combination from next year’s star-studded free agent class). For Yankee fans’ sake, hopefully that decision will be made by an owner who values winning baseball games. The investment bankers, however, will be rooting for the finance geek.

The Bronx Bombers may be cutting back on payroll, but that’s not because there is a shortage of Yankee dollars. According to Forbes’ 2017 business of baseball survey, the team’s enterprise value has reached $4 billion, or 33% greater than the second ranked Dodgers (click here for an analysis of the league-wide data). The Yankees’ revenue also reached a lofty plateau, topping $600 million, or nearly $100 million above Los Angeles. The pinstripes may have fallen short of the World Series last season, but from a financial standpoint, 2017 was a banner year.

Yankees’ Financial Snapshot, 2003-2017

Note: Revenue for each team is net of stadium debt and revenue sharing, and includes non-MLB events at the ballpark. Also excluded was the $18 million payout to each team from the sale of BamTech to Disney as well as profit/loss from RSNs in which teams own equity.
Source: Forbes.com

Despite the Yankees boasting the second largest revenue increase among all 30 teams (behind only the Braves), the bottom line did take a substantial hit, falling from $39 million in 2016 to $14 million last year. Forbes did not identify the reason for the drop in profit margin, but the culprit wasn’t player costs. In 2017, the Yankees spent $224 million on payroll plus the luxury tax, or almost $30 million less than the year before. As a result, the Bronx Bombers’ percentage of revenue spent on player costs plummeted to 36%, which was not only well below recent norms, but also ranked as the fifth lowest in the major leagues.

Yankees’ Payroll/Luxury Tax as a Percentage of Team Revenue, 2001 to 2018E

Note: Revenue for each team is net of stadium debt and revenue sharing, and includes non-MLB events at the ballpark. Also excluded was the $18 million payout to each team from the sale of BamTech to Disney as well as profit/loss from RSNs in which teams own equity. Payroll is based on final figures for each year released by MLB, and may not necessarily equal the amount upon which the luxury tax is based.  For 2018E, revenue is Forbes 2017 kept flat, and payroll is set at the luxury tax threshold of $197 million (for a proprietary tracking calculation of the Yankees 2018 payroll, see here).

Source: bizofbaseball.com and MLB releases published by AP (final payroll), MLB releases published by AP (luxury tax) and Forbes (revenue)

Continue Reading »

Major League Baseball posted another year of solid revenue growth, which contributed to steadily increasing franchise enterprise value, but operating profit took a downturn as teams increased investment in player development, marketing and analytics, according to the latest Forbes survey of the game’s financial landscape.

MLB Financial Snapshot, 2003-2017

Note: Revenue for each team is net of stadium debt and revenue sharing, and includes non-MLB events at the ballpark. Also excluded was the $18 million payout to each team from the sale of BamTech to Disney as well as profit/loss from RSNs in which teams own equity.
Source: Forbes.com

League-wide, net revenue was up 5%, with four teams pulling up the average. The Braves, at 22%, parlayed their new ballpark into the largest increase, while the Yankees, Astros and Dodgers benefited from deep postseason runs that inflated their top line. Meanwhile, only five teams recorded a lower revenue figure in 2017, with most of the league registering between flat and 7% growth.

Although revenues were up broadly, the bottom line wasn’t as robust. Two-thirds of the league saw their operating profit take a dip, including several substantial declines. The Marlins’ $50 million operating loss was both the largest overall figure and year-over-year decline, but four other teams also saw profits decline by over $20 million. Included in that group was the Yankees, who, despite taking in nearly $100 million more in revenue, saw EBITDA drop by $25 million, a margin decline of over 500 basis points. The opposite was true for the Dodgers, who reigned in their spending, enabling nearly every penny of the team’s increased revenue to flow through to the bottom line. Other teams enjoying a healthy profit spike were the Braves, Cubs and Rangers.

Despite the over 16% decline in league-wide operating profit, all but six teams remained in the black, with only the Marlins, Tigers, Orioles and Royals reporting substantial losses. The general health of the league contributed to a 7% rise in franchise values, which ranged from a 1% increase for the Pirates to 16% for the Athletics.

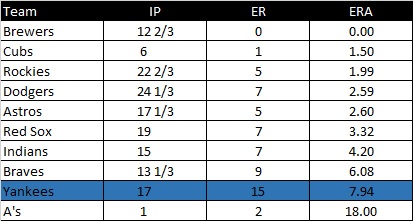
Top-5 and Bottom-5 Teams by Valuation, Net Revenue, EBITDA – 2017

Note: Revenue/EBITDA for each team is net of stadium debt and revenue sharing, and includes non-MLB events at the ballpark. Also excluded was the $18 million payout to each team from the sale of BamTech to Disney as well as profit/loss from RSNs in which teams own equity. Franchise values are enterprise value (equity – net debt). 
Source: Forbes.com

A hot topic during the off season was the degree to which the players have been sharing in MLB’s consistent revenue growth. Based on Forbes’ revenue figures, total compensation, which increased by 4% in 2017, remained just above 50% despite losing 30 basis points. However, these figures do not include investments made in player development initiatives and non-40 man salaries, which Forbes cited as a reason for the decline in operating profit.

MLB Player Compensation vs. League Revenue

Notes: Data Labels represent “year over year comp growth / total comp as percentge of net revenue”. Revenue is net of stadium debt service. Total compensation is actual payroll + player benefit costs + players’ share of the postseason revenue pool. For pre-2015, benefit costs were determined by working backward from the known 2015 amount and assuming a 4% growth rate (CBA calls for increases up to 10%).

Source: MLB releases published by AP (actual payroll), baseball-almanac (postseason revenue) and Forbes (net revenue)

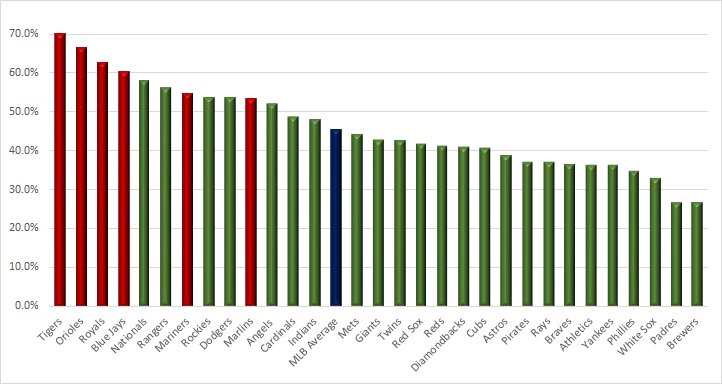
While the players’ share of revenue was stable in aggregate, each team’s level of investment was varied. The Tigers were the biggest relative spenders, allocating over 70% of revenue to player costs. Of course, that helps explain the team’s substantial operating deficit. In fact, all six teams that reported EBITDA losses also invested in player costs at a percentage well above the league average. The more profitable teams, however, did not follow a pattern. The Dodgers and Cardinals, for example, spent above the league average, but were highly profitable, while teams like the Phillies and Brewers were rewarded for their thrift. Notably, both teams, along with the Padres, were among the more aggressive spenders this past off season, so at least some of their largess has already been put to good use.

2017 Player Cost (Payroll/Luxury Tax) as a Percentage of Team Revenue for all 30 Teams

Note: Red shading indicates teams with an operating loss (EBITDA).

Revenue/EBITDA for each team is net of stadium debt and revenue sharing, and includes non-MLB events at the ballpark. Also excluded was the $18 million payout to each team from the sale of BamTech to Disney as well as profit/loss from RSNs in which teams own equity. Payroll excludes benefits and is based on final figures for each year released by MLB, and may not necessarily equal the amount upon which the luxury tax is based.

Source: MLB releases published by AP (final payroll), MLB releases published by AP (luxury tax) and Forbes (revenue)

MLB’s ever increasing franchise valuations speak to the underlying strength of the baseball business. This has made owning a baseball team more than just a vanity purchase…it’s now a pretty good investment. And, though it speaks to the health of the industry, that’s not necessarily a good thing. Instead of wasting time and energy worrying about pace of play, Commissioner Rob Manfred should be keen on ensuring that baseball owners don’t completely divorce the importance of winning games from their increasingly voracious profit motive. Winning at any cost may have gone out of style with the passing of George Steinbrenner, but profit at any loss should not be accepted as a reasonable alternative.

Footnotes

Forbes’ revenue figures differ from totals reported by MLB because they include ancillary stadium revenue (such as concerts and other sporting events), but exclude applicable stadium debt payments.

Forbes uses EBITDA (Earnings Before Interest, Taxes, Depreciation, and Amortization) as a measurement of operating income. Although usually defined as EBIT, Forbes not only adds back interest and taxes, but depreciation and amortization expenses as well. As a result, Forbes operating profit can appear higher than stated figures.

After several mediocre seasons, punctuated by a rapid rebuild, the Yankees have turned potential into power, and re-established themselves as one of the best teams in baseball. And, that was before acquiring Giancarlo Stanton during the off season. With excitement soaring to heights unmatched by even a Judge-ian blast, the Yankees seem poised for a championship season, but can they shoulder the burden of these heightened expectations?

The Bronx Bombers are back, but they haven’t quite returned to full glory. Although the ceiling on this year’s team has been raised considerably, and the prospect of having a losing season appears far-fetched, there is still an element of uncertainty baked into the upcoming season. In other words, these are not Bella Jeter’s father’s Yankees just yet, though, this could be the season when they finally reach that level.

What makes the Yankees’ ceiling so high is the combination of power and depth in both the starting lineup and bullpen. What lowers the floor is the possibility of youthful regression as well as a lack of durability in the starting rotation. Although the Yankees’ five starters have all had recent success, and all but sophomore Jordan Montgomery have merited serious Cy Young consideration at some point in the past, injuries are somewhat of a heightened risk and consistency is not a given. The Yankees’ bullpen should be more than equipped to handle a disproportionate innings burden, but if the rotation were to breakdown or fail to provide enough innings on a consistent basis, the ripple effect could take its toll on the entire staff.

A deep farm system also bodes well for the Bronx Bombers. Not only do the Yankees have several promising position players, such as Gleyber Torres and Miguel Andujar, and pitchers, such as Chance Adams, ready to serve as reinforcements, but the organization has more than enough chips to cash in at the trade deadline. However, it should be noted that the Yankees’ desire to remain below the luxury cap threshold could mitigate their ability to add quality players during the season, and this also contributes to a lower win total in a reasonable worst case scenario.

Following are 11 key questions outlined and answered in the context of reasonable best, base, and worst case scenarios. Also, scroll below to see how well the Captain’s Blog has predicted the Yankees’ annual win total in the past and click here to see a forecast for the rest of the league.


Best Case Scenario: 102 wins

The addition of Giancarlo Stanton and continued development of young stars like Aaron Judge and Gary Sanchez turn the Yankees’ offense into a juggernaut. Meanwhile, relative health and success in the rotation allows Aaron Boone to avoid overextending his bullpen.

  1. Luis Severino shows no signs of fatigue after last year’s workload. The young righty continues to be the ace of the Yankees’ staff and merit Cy Young consideration.
  2. Masahiro Tanaka and Sonny Gray are able to throw around 180 innings apiece, and, though not dominant, each performs at an above average level.
  3. CC Sabathia misses a few starts throughout the year, but is able to provide 150 innings that are at least league average.
  4. Jordan Montgomery builds on his rookie campaign by taking the ball every fifth day and improving upon his consistency.
  5. Length from the starters allows the bullpen to avoid a disproportionate burden. Relative health allows Boone to spread the innings around, and a rebound from Dellin Betances sees him return to being one of the most dominant relievers in the game. This depth allows the team to overcome inevitable hiccups by individual relievers and gives the Yankees a stranglehold on the late innings for the entire season.
  6. Judge and Stanton are both able to approximate their 2017 campaigns.
  7. Gary Sanchez stays healthy and improves upon his defense, making him an MVP candidate.
  8. After returning from his ankle surgery, Greg Bird is able to play around 100 games and gives the Yankees a lefty power complement to their right handed heavy lineup.
  9. Either Brandon Drury or Neil Walker performs at a well above average offensive level, while the other is at least league average. Both are competent on defense, which offers flexibility that allows Boone to deploy his bench with efficiency.
  10. Aaron Hicks establishes himself as an everyday major league centerfielder who is above average on both offense and defense.
  11. When needed, the Yankees call upon young players like Tyler Austin, Tyler Wade, Miguel Andujar and Gleyber Torres who are able to contribute meaningfully in either an everyday or utility role.

Base Case Scenario: 95 wins Continue Reading »

American League East

The Yankees and Red Sox should battle each other all season, though each is capable of breaking away with a blowout season. However, both teams have rotation concerns (at least what qualifies as concerns for teams capable of winning 100 games), meaning the Bronx Bombers’ bullpen depth could give them the edge. The Blue Jays’ starting rotation will keep them in the race, assuming Marcus Stroman and Aaron Sanchez are healthy, but a suspect lineup and having to face off against the division leaders for 36 games will hamper their wild card efforts. Are the Jays willing to make a big trade to add players at the deadline? If so, their postseason aspirations would be more credible, but Toronto has the feel of an organization that might not mind waiting until next year. That’s why a deadline trade of Josh Donaldson seems more likely. Meanwhile, the Orioles and Rays, though respectable in a tough division, will battle to the bottom, with Baltimore’s descent accelerating after the trade deadline, especially if they choose to trade Manny Machado.

American League Central

After absorbing key losses like Bryan Shaw and Carlos Santana, the Indians will take a step back, but fortunately for the Tribe, there isn’t another team close on their heels. The Twins will benefit from a favorable intradivision schedule that should inflate their win total, but the Indians will enjoy that advantage as well, so Minnesota will have to settle for a wild card. The White Sox and Royals are teams going in the opposite direction. Kansas City could tread water for a month or so, but by the time the deadline rolls around, the Royals are likely to be sellers. The White Sox, on the other hand, will probably struggle early as their talented collection of young players get acclimated, but a late season improvement could be in the offing. As a result, the two teams are likely to cross paths during the season, and continue headed in the opposite direction for years to come. Last, and most certainly least, are the Tigers, who figure to be the favorite for the number one pick in next year’s amateur draft.

American League West

The Astros are the class of the West, and should easily run away with the division. Despite an active off season, the Angels haven’t moved the needle much, and, if Shohei Ohtani isn’t the savior that was envisioned, the Halos could struggle to even approach .500. If there’s one saving grace for the Angels, it could be that the weakness of the teams below will be even greater than expected, allowing the team to vulture enough wins to sneak into a Wild Card.  From among the bottom three in the division, the Mariners are best equipped to make a run, but Seattle seems destined to once again hover around .500. The Rangers and Athletics both bring a patchwork roster into the season, and lack the pitching depth needed to be a viable contender.

League Leaders: Astros, Indians, Yankees, Red Sox

In the Hunt: Twins, Blue Jays, Angels, Mariners

Wait ‘til Next Year: Orioles, Rays, White Sox, Royals, Tigers, Rangers, Athletics

  Continue Reading »

« Newer Posts - Older Posts »