Spring training stats mean nothing. At least that’s what most people seem to think. However, a recent correlation analysis published by Fangraphs.com suggests otherwise.
In particular, the fangraphs’ study concluded that walk and strikeout rates in the spring (both good and bad) may foreshadow performance during the regular season, which isn’t exactly a revolutionary conclusion. After all, even though very few people place a premium on the predictive value of spring stats, not many consider them to be completely random. The real question then becomes how significant is the correlation, and is the study sound enough to justify a conclusion of causation? As Baseball Prospectus’ Colin Wyers’ summed up during a late-night twitter barrage, the fangraphs’ analysis has a few shortcomings, so, at the very least, it’s hard to take the findings at face value.
Instead of getting bogged down in issues like sample size, regression coefficients, input divergence, and control factor reliability, a simple test of the hypothesis seems to be a worthwhile alternative. If extreme walk and strikeout rates really do presage future results, we should be able to see some evidence by closely evaluating the most extreme examples.
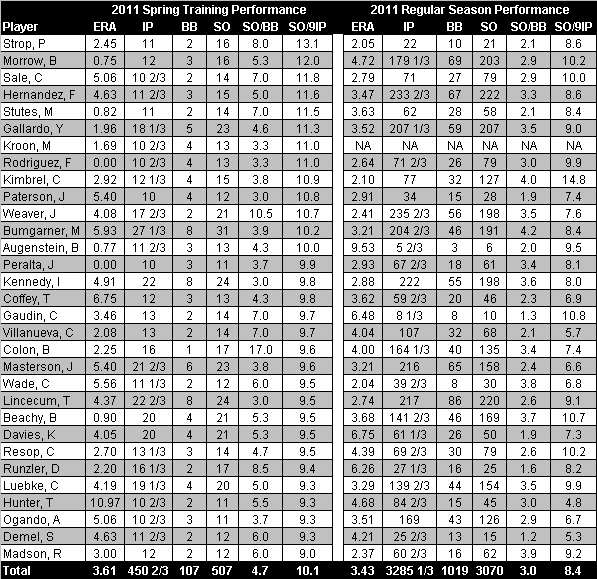
Using 2011 as a test case, the following parameters were defined to identify candidates whose spring performance suggested they were poised for either a breakout or breakdown. For the breakout group, all pitchers with at least 10 innings, a K/IP rate of at least 9.0, and a K/BB rate of at least 3.0 were considered. The breakdown group was composed of pitchers with the same innings limit, but K/IP (4.0 or lower) and K/BB (2.0 or lower) rates on the other extreme. Each segment was then compared to their regular season performance to determine if the subsequent results were in line with the expectations fostered by their spring training performance.
Breakouts: 2011 Spring Training Pitching Leaders

Note: Includes all pitchers with the meet the following 2011 Spring Training criteria: IP >=10; K/BB >=3; and K/9IP >=9.
Source: MLB.com
Using the criteria cited above, 31 pitchers qualified as potential breakout candidates. As a group, these hurlers pitched to a 3.61 ERA in 451 innings with respective K/BB and K/9IP rates of 10.1 and 4.7. So, how did they do in the regular season? Pretty much the same. In 3,285 innings, the same group posted an ERA of 3.43 with respective K/BB and K/9IP rates of 3.0 and 8.4. Considering the innings increase, the relative performance is remarkably similar. Granted, pitchers like Jered Weaver, Felix Hernandez, Tim Lincecum, and Yovani Gallardo don’t qualify as “breakout” performers, but even if you remove these established stars from the comparison, the similarity holds (3.60/10.0/4.8 in the spring versus 3.58/8.4/3.0 in the regular season).
Based on the screen used above, we would have been able to identify several surprises, including breakout seasons by the likes of Craig Kimbrel, Ian Kennedy, and Justin Masterson. Perhaps even more significant, approximately 75% of the pitchers who made it through the screen pitched to an ERA below their league’s non-park adjusted average. So, according to this anecdotal snapshot, it does seem as if walks and strikeouts in the spring can add up to success in the summer.
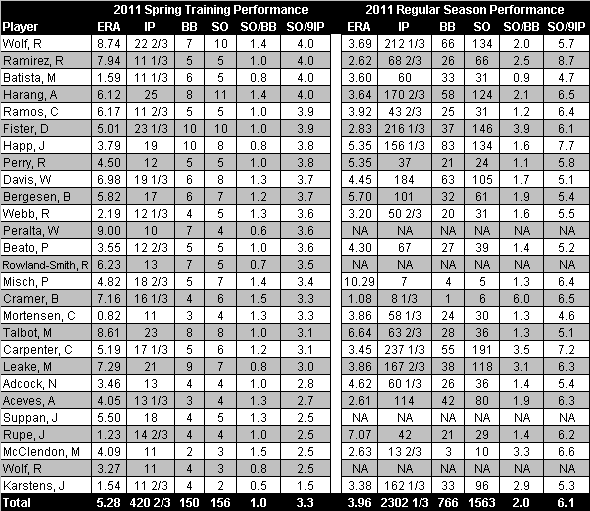
Breakdowns: 2011 Spring Training Pitching Laggards

Note: Includes all pitchers with the meet the following 2011 Spring Training criteria: IP >=10; K/BB <=2; and K/9IP <=4.
Source: MLB.com
Twenty-seven pitchers qualified for the “breakdown” group, compiling an ERA of 5.28 with respective K/BB and K/9IP rates of 1.0 and 3.3. However, unlike the spring leaders, this group of laggards did not perform in line with its lowered expectations. In 2,302 regular season innings, or about 5.5 times as many as in the spring, the breakdown group posted an ERA of 3.96 with respective K/BB and K/9IP rates of 2.0 and 6.1. This across the board improvement, which still holds even after removing Chris Carpenter from the group, contradicts the notion that poor spring performances can be a bad omen for the regular season. Although very few pitchers included in this group improved much beyond league average, the breakout years of Jeff Karstens and Doug Fister were disguised by their spring struggles.
It’s hard to explain why strong spring performances in 2011 translated better than poor ones, especially because this divergence contradicts the fangraphs’ study, which concluded that subpar exhibition statistics were more significant than good ones. One possible explanation could be selection bias. After all, pitchers who struggle mightily in the spring usually don’t make the team unless they have solid track records (approximately 25% of the laggard group pitched fewer than 14 innings in the 2011 regular season). In other words, there’s a better chance their spring difficulties were just a fluke.
The snapshot provided above neither confirms or disproves the fangraphs’ analysis, which itself is open to wide interpretation. However, the implication from both that strong strikeout and walk rates can help forecast breakout seasons is enough to pique my interest, which, naturally, begs the following question: which 2012 spring performers, based on the criteria defined above, are poised for breakout season?
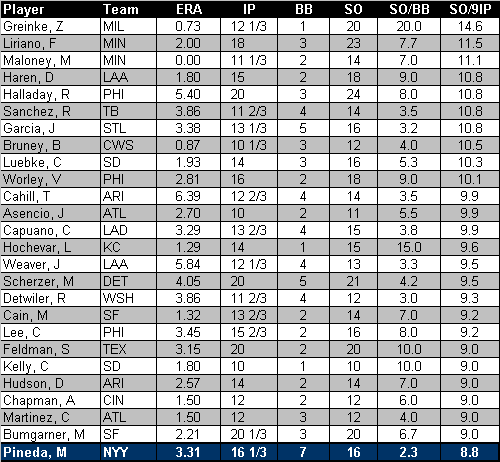
2012 Spring Training Pitching Leaders

Note: Includes all pitchers with the meet the following 2011 Spring Training criteria: IP >=10; K/BB >=3; and K/9IP >=9.
Source: MLB.com
Once again, the list of top spring performers contains some usual suspects, but not everyone is a proven superstar. In particular, names like Luke Hochevar, Max Scherzer, Scott Feldman, and Madison Bumgarner all jump off the page. All four of these pitchers have been highly touted at some point in their career, and some have even had modest success in the majors. Could 2012 be the year when they finally take the next step? Zack Greinke’s and Francisco Liriano’s appearance atop the list is also of interest. After disappointing 2011 campaigns, perhaps both pitchers are poised for a rebound? Finally, Aroldis Chapman’s miniscule walk rate is very compelling. If the Reds fire-baller, whose career BB rate is nearly seven per game, can finally learn control, his performance could zoom off the charts.
At the end of the exhibition season, I’ll revisit these Spring Training numbers to refine the list and then keep tabs on each member’s performance during the year. Of note to Yankees’ fans, Michael Pineda could wind up being included in the group. With two starts to go, the young right hander boasts K/BB and K/9IP rates of 2.3 and 8.8, so it wouldn’t take much for Pineda to elevate himself into the breakout class. Now, just imagine if he gets his velocity back.

[…] confirm this notion, another blogger found this speculation to be true. William Juliano at The Captain’s Blog looked at K/IP and K/BB ratios from the 2011 preseason and identified players with stats above a […]