(The following was originally published at SB*Nation’s Pinstripe Alley; unless otherwise noted, WAR refers to fangraphs’ calculation of the metric)
Is it better to maximize the number of times a reliever can be used or the length of his appearances? Yesterday at frangraphs.com, Dave Cameron tried to answer that question by comparing bullpen performance over the last 30 years and concluded that because there hasn’t been an aggregate improvement, teams would be better off returning to the past practice of using relievers for longer stints.
According to Cameron’s data, not only have modern bullpens failed to improve performance over the last 30 years, they also haven’t been called upon to pitch more often. Instead, the number of relief innings pitched has simply shifted from premium relievers to those filling out the roster. In other words, according to this conclusion, the Sergio Mitres of the world have become common place on major league rosters, despite little evidence to suggest that they provide some measurable derivative value.
Percentage of Batter’s Faced by Relievers and Starters, Since 1982
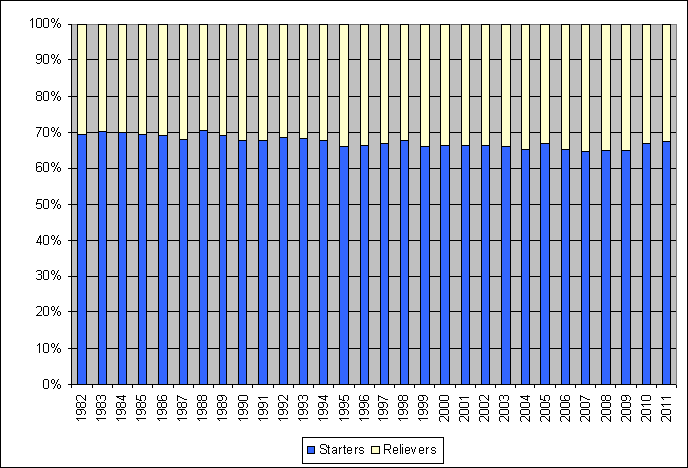
Source: fangraphs.com
In response to Cameron’s conclusion, Tom Tango wondered if the ability of extended bullpens to maintain performance implies that the best relievers (i.e., the ones around whom modern bullpen usage revolves) are actually doing better because they have to pick up the slack for the dregs? If true, this would suggest that modern bullpen tactics have been beneficial, provided they are in compliance with usage patterns based on leverage. Almost like pawns in a game of chess, it could be that modern managers are sacrificing the last men in the bullpen to set up a fool proof endgame.
Comparing data from 1982 and 2011 (the endpoints in Cameron’s broad analysis), the transfer of innings from effective relievers to ineffective relievers becomes clear. In 1982, 56% of relievers had a positive WAR and faced 73% of all batters. However, in 2011, the percentages flipped as only 44% of relievers had a positive WAR and the rate of batters faced dropped to 63%. What’s more, there was also no significant difference between relievers at the top of the food chain. In 1982, the 25 best relievers by WAR had an aggregate ERA of 2.57 and combined WAR of 52.7. Meanwhile, in 2011, that same elite group posted an ERA of 2.29 and a combined WAR of 48.3. There was, however, one big difference: the number of innings pitched. In 1982, the best relievers pitched almost 800 innings more, or about 30 more per pitcher. Basically, even at the top, the same tradeoff exists: slightly better performance for significantly fewer innings.
Top-25 Relievers, 1982 vs. 2012

Note: Ranking based on WAR.
Source: fangraphs.com
Based on this data, it seems as if Cameron’s conclusion is sound. However, is there more to the story? Can we make valid judgments based on the aggregate numbers, or, do we need to consider context?
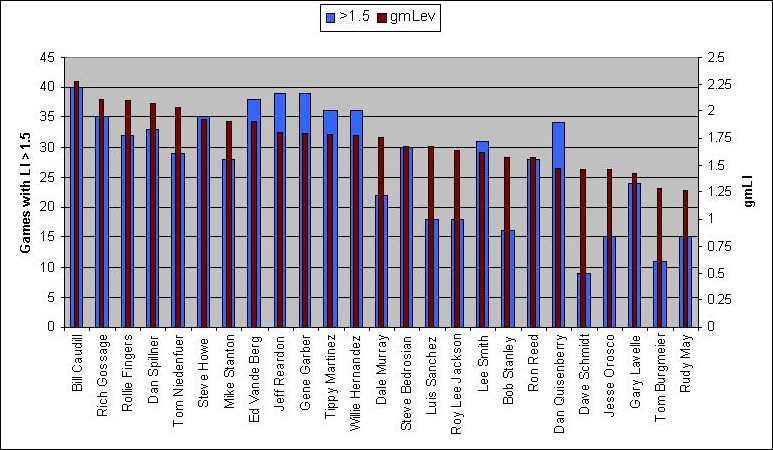
In sabermetric terms, one way we can measure context is by considering leverage. If managers are able to take advantage of the modern bullpen theory to deploy their best relievers at just the right time, and hold back their fodder for games that are out of hand, it would be made evident by an examination of leverage. Once again using 1982 and 2011 as our test cases, we find that the top-25 relievers in 2011 appeared in 795 games with an average leverage index of at least 1.5 (1 is considered “average pressure”), compared to 691 for the best relievers in 1992. Spread over the lot, this difference amounts to four additional high pressure deployments per season. Is that significant? Considering the innings tradeoff, it doesn’t seem so. In addition, it’s worth noting that the median leverage index when entering the game (gmLI) was higher for top pitchers in 1982 (1.76) than 2011 (1.58), so it doesn’t appear as if managers are more strategically using their best weapons (and, it suggests the length of appearance may be watering down cumulative leverage figures).
Into the Fire: Leverage Metrics for 25 Best Relievers, 1982 vs. 2011
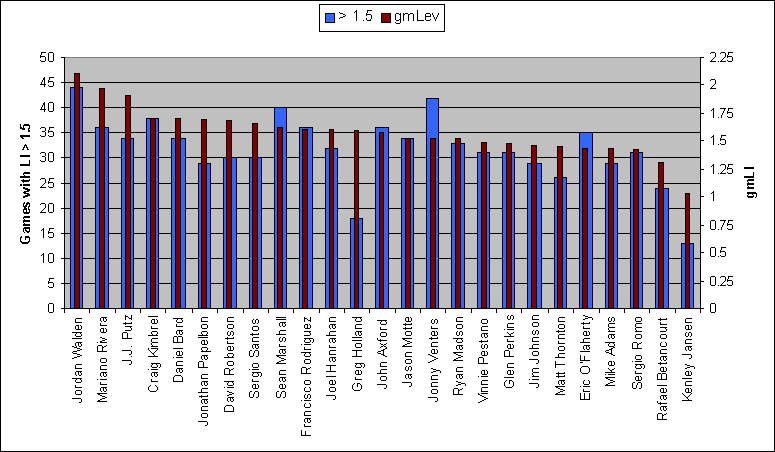
Note: Ranking based on WAR; gmLI is the average leverage of all points at which a pitcher enters a game. LI is leverage for all game events (1 is considered “average pressure”)
Source: fangraphs.com
There are two sides to the leverage equation. Among the cream of the crop, it doesn’t seem as if top relievers are being optimally deployed, but what about at the bottom? In 2011, the bottom-25 relievers were used in 212 games with leverage of 1.5 or greater and had a median gmLI of 1.08, compared to 205 games and 1.29 for the worst pitchers in 1982. Although the 1982 dregs pitched 400 more innings than their 2011 counterparts, they also had an ERA that was almost a run lower, so, all things considered, this comparison also appears to be a wash (WAR for the 1982 group was -14.7, versus -15.7 for 2011).
Admittedly, by limiting this analysis to only two seasons (1982 versus 2011), there is plenty room for error, but, at the very least, the data seems to support the conclusion that despite vastly different strategies, bullpen performance has remained the same. Of course, that doesn’t make the modern approach to managing relievers worse; it just makes it different. After all, if the old and new methods achieve the same results, does it matter which one is used?
Cameron argues that it would be better to return to the “longer stint” approach because it not only saves a roster spot or two, but it also lessens the perceived value of the closer, which, by extension, would curtail the exorbitant salaries paid to the men who own the ninth inning. It is here where I disagree with Cameron.
Still Kicking: Older Relievers in the Major Leagues
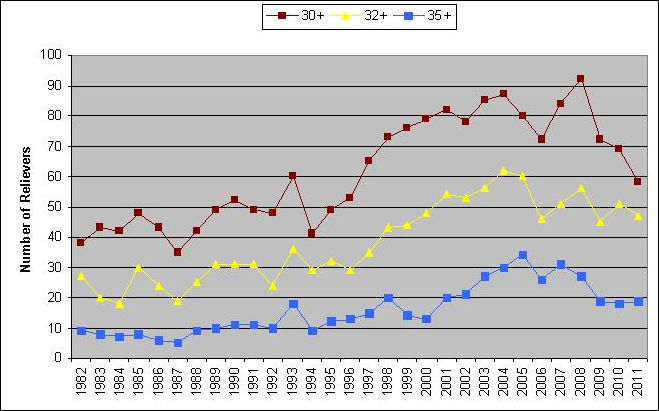
Note: Based on a minimum of 40 innings pitched.
Source: Baseball-reference.com
In framing his argument, Cameron cited Bob Stanley, who pitched 168 1/3 innings in 1982, as an example of the workload shouldered by bullpens of the past. However, it’s worth mentioning that after his 1982 campaign, Stanley only had four more productive seasons and retired at the age of 34. Meanwhile, Mariano Rivera is pitching better than ever at the age of 41. That’s just an anecdote, but more “old” relievers are still kicking around versus 30 years ago, so maybe the modern approach is helping to prolong careers. Of course, one could argue that health is in the best interest of the pitcher, not the team, but that’s a little too Machiavellian. Also, that philosophy only applies when the reliever in question is fungible. Relievers like Rivera and Jonathan Papelbon, for example, are not easily replaceable, which is why teams should be interested in keeping them healthy for as long as possible (and willing to pay them).
So, where does that leave us? It seems certain that as a group relievers are no better or worse today than they were 30 years ago. However, instead of advocating a return to the past with the goal of saving money and roster spots (after all, if not wasted on marginal relievers, they’d probably be squandered on below average position players), perhaps the focus should be on improving bullpen usage within the modern theory? The one thing we know for certain is today’s relievers do pitch in more games, but, unfortunately, managers too often defer to the save rule and waste many of these appearances in low leverage situations. If managers would instead commit to shooting their best bullets at the right targets (i.e., high leverage situation regardless of inning), the current philosophy of shorter outings might prove to be the most optimal. At the very least, this hybrid approach is worth trying, especially when you consider that a return to the past approach promises little more than the status quo.

The one issue that’s not addressed here is how “going back” to 1982 would impact starting pitchers. Let’s remember that having a reliever (let’s call him, oh, hmmm, okay, let’s call him Mo) who can pitch one inning at a greater frequency than another reliever (let’s call him, oh, hmmm, okay, let’s call him Goose) will have an impact on the starting rotation. If Goose is called on for more high-leverage situations, meaning called in prior to the 9th, with men on base, and is pitching 120 innings of relief a year compared to Mo’s 60 innings, then someone has to be eating up those 60 innings.
Back in 1982, starters had more complete games. In 1982, we were only in the 9th year of the DH “experiment.” We were only seven years removed from Catfish Hunter pitching 300+ innings and completing 30 games. By having starters complete a higher percentage of starts it allowed Goose to be saved up for the games in between when he was needed. Today, the bullpen is almost always used because starters don’t complete games, hence Mo comes in more frequently, but for less innings.
So if we go back to 1982, top relievers will pitch more innings per appearance, pitch more innings on the year, but may appear in less games. Yet in order to go back to 1982, we will need the starters to pitch a little further into each game, and a top staff is going to need at least one guy like Hunter or Palmer who can be counted on to complete 25+ games to provide enough rest between the closer’s more lengthy relief apperances, preventing him from appearing three or four games in a row.
You raise a good point. In fact, I should have a related post on the topic sometime soon.
[…] benefit from using relievers in this manner. William Juliano expressed this view on the issue in a really good post he did at his own blog as a follow-up, and looked into the relative performance of the top tier of relievers from both […]
I don’t think you can answer the question by looking only at the top 25 relievers. If you look at all relievers, they produce more WPA now than back in the 1970s or 1980s. It looks to me like they generate more WAR/team as well, though I haven’t checked carefully. On balance, it appears that modern usage (although it perhaps could be improved) delivers considerably more value than the old approach.
You would have to look at WPA/team because it cumulative. On that basis. The WPA/ team of 1.75 is higher than every season but three since 1982, and only 2007 (which featured the most relief innings) was significantly higher (2.35). When you also consider there were fewer relief innings back in 1982, I’m not sure how you can use WPA to support your conclusion.
William: It turns out that 1982 is a huge outlier, with 46 reliever WPA — that’s more than the prior 4 seasons combined, and also more than the next 4 seasons combined. I’m sure you didn’t pick it for that reason, but 1982 really isn’t typical of the older seasons. You have to take averages over multiple seasons to see the story here.
This is the approximate average reliever WPA for MLB per season:
1974-86: +12
1987-99: +24
2000-11: +47
Even adjusting for more teams, relievers are clearly generating more wins today than they were 20-30 years ago. (Assuming this data is correct.)
Even if your point about the top 25 relievers having equal value holds up when looking at other seasons, I think you will find that the next tier of relievers (say, #26 to #75) are much more valuable today.
1982 is an outlier. However, some of the increase your suggesting is mitigated by the corresponding increase in innings. Besides, I am not sure if WPA really is the best measuring stick. Over the years, we’ve seen relief inning shift from the earlier innings to the later innings, which should lead to a jump in WPA. If relievers are simply scavengering WPA from starters, I am not sure value is being added.
Having said that, as I concluded in the subsequent piece, starters may not be able to pitch as long as they once did, so the modern approach may be necessary and, therefore, value-added.
Yes, that’s a good point re: starters: we are not going back to starters providing 70% of IP. And the reduced workload for starters very likely improves their performance, so even if you somehow could increase their workload you would pay a price in reduced starter performance.
I’m not sure what it would mean to “scavenge” WPA from starters, when WPA can only be accumulated by pitching at an above-average level (and at times it matters). And the fact relievers pitch more often in innings 6-7 and a bit less in the very early innings would not automatically increase WPA. This isn’t an explanation at all.
But if you don’t like WPA, what happens to reliever WAR/team over these same years? Doesn’t that increase too?
By scavenge WPA, I mean in the “old days”, a pitcher working on a 1-0 shutout was probably more likely to close out the game. Now, the closer is used. That transfers WPA from starters to relievers. Also, it was more common for relievers to enter the game early on during blowouts, which may have depressed their WPA levels. It’s almost like a chicken and egg scenario.
As for reliever WAR/team, we get the following:
1980-85 – 2.76
1986-90 – 2.86
1991-96 – 2.53
1997-01 – 2.88
2002-06 – 3.05
2007-11 – 3.06
There is an increase in the last decade, but each year in that 10 year period had about 3,000 more reliever innings.
[…] Comments « Grabbing the Bullpen by the Horns: What Is the Optimal Strategy for Using Relievers? […]
[…] Saturday, I posted a follow-up to a recent Fangraphs’ analysis of relief pitchers’ aggregate performance over the last […]
I was worried that the Fangraphs WPA data might be incorrect, so I looked at B-Ref. But it tells the same story: today’s bullpens deliver much more value. And WPA, which I’m not generally a huge fan of, is exactly the right metric to answer this specific question, because it incorporates the critical element of leverage (which WAR does not). If modern usage has an advantage, it is mainly in allowing a better match between leverage and pitcher talent. You have to measure that to answer the question.
Using B-Ref data, I compared 1978-80 to 2009-2011, looking at roughly the top 3 relievers per team in both cases: the top 234 relievers in IP from 1978-2011, and top 270 from 2009-2011. The difference in WPA per team is substantial:
1978-80: 1.05 WPA in 256 IP
2009-11: 2.46 WPA in 207 IP
So today’s relievers (at least the top 3) are generating almost 1 and a half additional wins per team. That’s a big change.
WPA data confirms your finding that the very best relievers today generate the same value as in the past. If we look just at the best WPA relievers (top 26 per year 1978-80, top 30 per year in 2009-2011), there is only a small advantage for today’s relievers: 2.30 in 78-80, 2.55 in 09-11 (although today’s top relievers do this in far fewer innings: 69 IP compared to 96 IP for earlier top relievers).
What’s really changed, which you didn’t look at, is the contribution from the #2 and #3 relievers. While the #2-#3 relievers in today’s pens are roughly league average (about 0 WPA), in the old days these other relievers were well below average, about -1.25 WPA on average. So in addition to letting top relievers deliver equivalent WPA in fewer innings, the modern usage pattern is generating far more value from setup men (and perhaps giving very low LI innings more efficiently to the worst relievers).
Again, I think you are running into a chicken and egg scenario. I don’t think you can simply take WPA at face value because usage dictates the totals. For example, closers now are more likely to pith the last inning of a 1-0 game; relievers then ran greater wish if -WPA by entering games with men on base; and relievers then were more likely come into a game early and remain as the score diverged. In all three examples, the WPA totals would be depressed for the older reliever and increased for the newer reliever. What we need to determine is what strategy best serves reliever performance regardless of leverage, and then how best to deploy that performance to leverage.
I guess I would boil down my position to the following: because all the factors of the modern approach heavily favor relievers, their current WPA should be much higher than it was a while back, and, because it isn’t, that suggests to me that bullpen usage could be refined even further.
William, the average leverage for relievers today is the same as it was back in the 1970s and 1980s. So if you are suggesting that today’s relievers have some kind of automatic advantage because they pitch in more high-leverage situations, that simply isn’t the case. And none of your three examples work to in any way to explain a higher WPA for current relievers. If a pitcher enters with men on base, for example, the higher risk of runs allowed is already calculated by WPA and assigned to the pitchers who allowed those baserunners — that’s the whole point of WPA. So I don’t know what you’re getting at there.
You say “What we need to determine is what strategy best serves reliever performance regardless of leverage, and then how best to deploy that performance to leverage,” but that is exactly what WPA already does for you! It represents the combined impact of performance and leverage.
None of this proves that current usage is optimal, of course. But it does show that current usage is superior to the old pattern.
That’s not what I am saying. Instead, today’s relievers are put in a position to compile WPA because their usage patterns are more conducive to success (or, more conducive to avoiding -WPA). For example, a reliever brought in with 2nd and 3rd one out in the 7th might have a higher reward, but the risk is also greater. The reliever who enters up two runs in the ninth has lower reward ceiling, but less risk. Just because relievers are benefiting from this approach doesn’t mean the team is.
So here’s the problem I have. On average there may be no difference in performance when you net everything out. Perhaps relievers even get a slight advantage by using the 1-inning approach.
However, it seems to me that there are at least several teams passing on a very productive platoon in order to keep Collin Balester on the roster.
If you were to ask every manager in the majors if they would prefer a left field platoon of Dwight Smith and Lloyd McClendon (1989) or Paul Assenmacher, everyone would say Smith-McClendon.
But every one of them in a blind taste test would break camp with Assenmacher.
I think the assumption that the bench player is not going to be worth carrying is a bit too general.
Perhaps, but looking at the rosters of today’s teams, I don’t see much depth, so I am not sure how carrying another position player would provide value.
Exactly right. There is no depth because there are 12 and 13 pitchers. It’s doubtful that John Lowenstein, Gary Roenicke, Garth Iorg and most of the successful platoon partners would even make a roster today. That’s why Matt Murton can’t make a major league roster.
William:
You may be interested in a continuing discussion of these issues over at The Book Blog: http://www.insidethebook.com/ee/index.php/site/comments/are_relievers_being_used_optimally_compared_to_1980/. This is a complicated issue to be sure, but it seems clear both that modern relievers pitch a bit better (per batter) than relievers from 30-40 years ago, and also that the performance of today’s relievers is better leveraged. The net result is something like an additional 1-1.5 wins per team.
Guy, umping in late to this discussion, but two questions. This might be semantics more than anything else, but when you say relievers pitch a bit better per batter, what does that mean? Are you suggesting that today’s relievers are more skilled in getting batters out in high-leverage, or perhaps all situations? Or is what you’re suggesting is that the manager has more options (arms) for lefty/righty match-ups, and that his closers are more fresh (pitching less innings) so therefore more effective? So perhaps it’s not that relievers pitch a bit better, but that managers construct and manage the pen a bit better.
Secondly, how can the net results be an additional 1-1.5 wins per team? Every win for one team has to have a corresponding loss for another.
[…] would take some courage for Girardi to turn his back on modern bullpen theory, especially when league-wide statistics over an extended period of time suggest it has been relatively successful. However, the names on the Yankees’ roster seem to beg […]
[…] jumping into the exercise, it’s important to remember that the philosophy of bullpen usage has changed significantly over the years. Before the emergence of stoppers like Mike Marshall, Rich Gossage, […]